Project Work
A little and simple page to display our Project Work
Project Work DIQU
Group 4: AgriDIQU
Members:
Files
All the files can be found on the Github or in the release section ready to use.
Introduction
Design and implementation of software to monitor the level of the content of 7 silos in an industrial plant in North Dakota.
The silos are grouped in 2 blocks (one contains 3 and the other 4 silos) in two areas located 150 meters from each others.
Each silo has 8 sensors to monitor the content level and a temperature and humidity sensor outside to monitor the outside environment. All the sensors are connected to a PLC that compute and elaborate all the data.
A local server takes all the necessary data from the PLC and send them to a server in the cloud where they are displayed in real time.
Initial brainstorming
In our initial brainstorming, we gathered as much information as possible about the client situation and we wrote a quote and a detailed overview and description of the project that can be found on Drive
During this phase we created some diagram to better understand the project that can be found below.
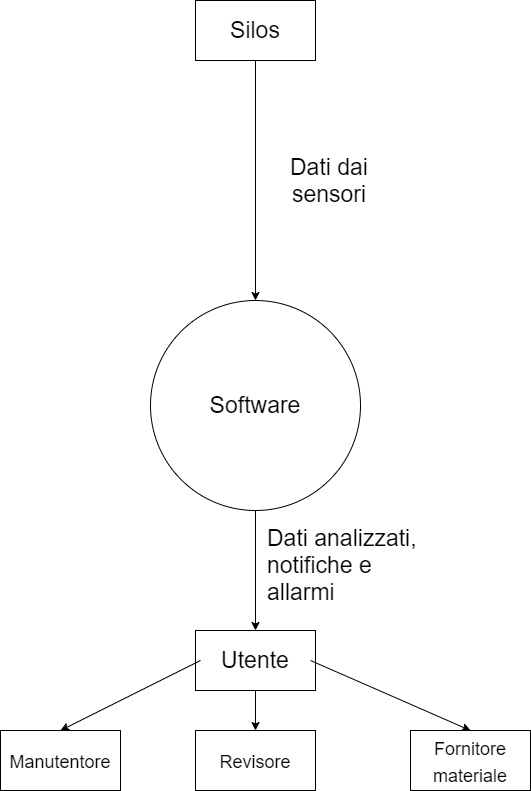
Overview
System Context Diagram
Project Plannning
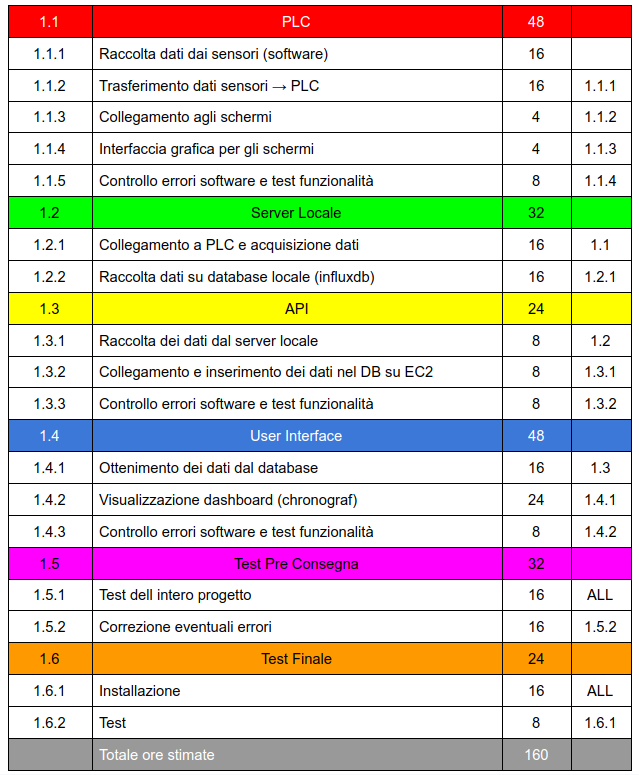
After the initial draft we focused on planning the whole project and more specifically we broke down the project into small tasks creating a Work Breakdown Structure specifying if a task will depend on another task.
Work Breakdown Structure
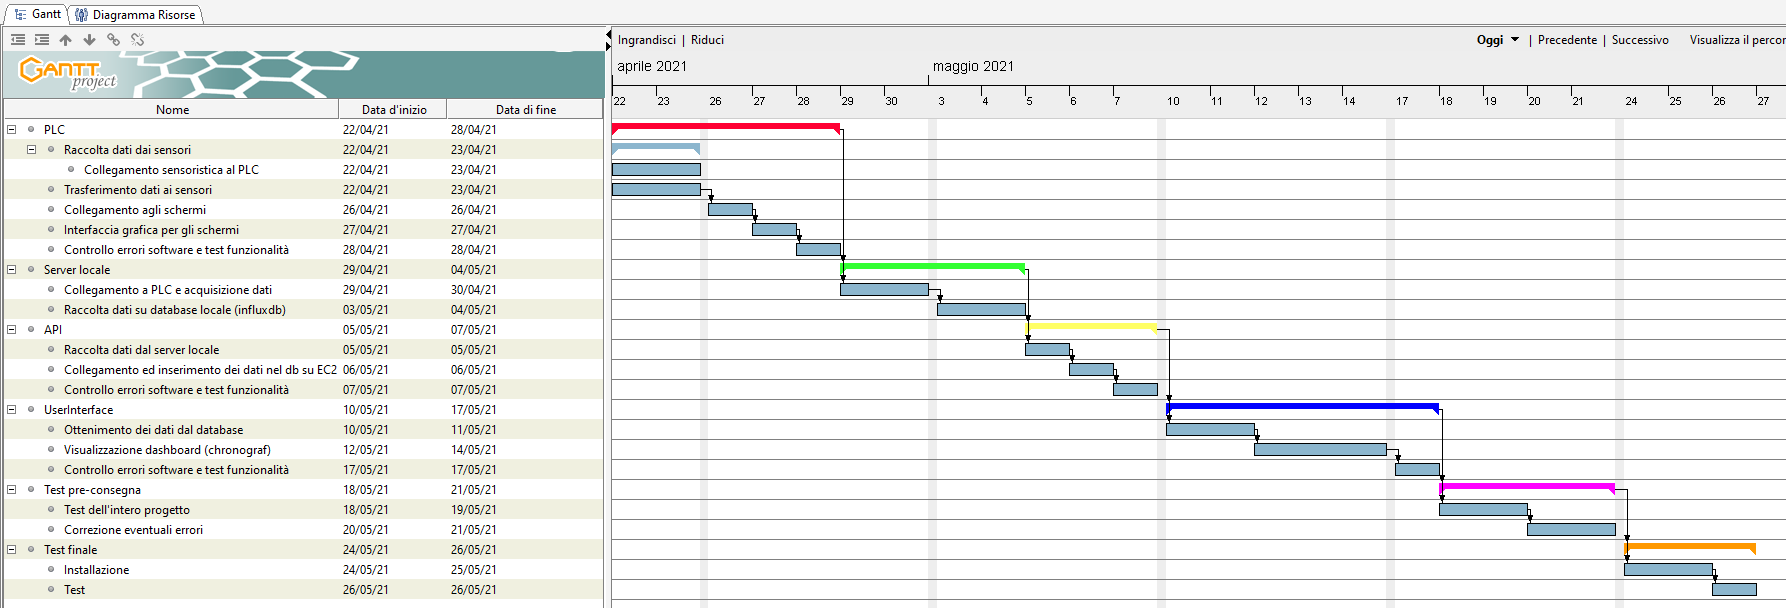
The WBS helped us to create the Gantt Diagram to better visualize the project over time.
Gantt Diagram
Agile Method
After using the traditional method to set up our project we tried to use the Agile method, a different type of project management process where demands and solutions evolve through the collaborative effort of self-organizing and cross-functional teams and their customers.
To embrace the Agile methodology we used and created our user stories, short text written with the user experience in mind.
An example could be: As a controller I want to see the level of the content inside the silo to manage the refueling and the valves.
Or: As a manager I want to manage all the silos remotely because I don’t want to be there physically
Trello
At the end we created a Trello kanban to manage and visualize all the tasks we needed to do to complete the project.
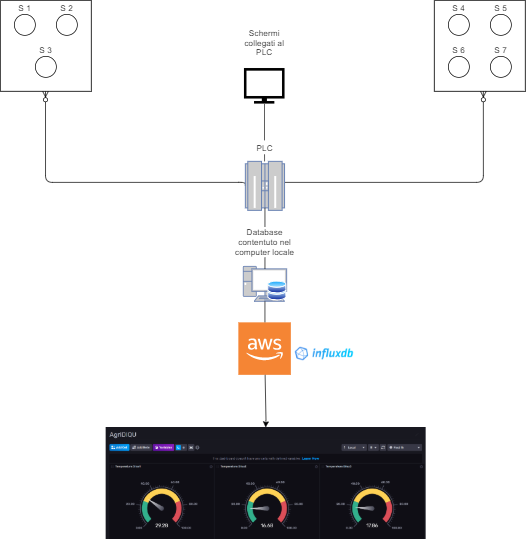
General Overview
After the initial brainstorming phase this is the result that represents how each component of this project communicate with each other.
Let’s start with the PLC!
PLC
For the PLC we worked on Simatic Manger S7 for the PLC logic and then with WinCC Flexible for the connection and the graphical environment.
The first step was to simulate the PLC envirimageonment because we weren’t able to test the project on a physical PLC. Then the object was to recreate all the logic in different blocks using languages like AWL and KOP.

As said in the introduction each silo has 8 senors for the level of the content and outside it has 2 sensors: one for the temperature and one for the humidity. Then it has 2 valves: one that insert the liquid/solid and one that remove what’s inside.
We thought to block the insertion of the content when the highest sensor was triggered and to block the discharge when the first sensor is no longer triggered by the content inside. In this case is not possible to empty the silo so we added a second button that allows to discharge all the content that’s inside so the silo can be easily emptied from its content and filled with another material.
For a better estimate of the content’s level we calculated the volume and its mass through a selection of materials.
If a worker would like to have an easy to read overview there is a page where you can easily see all the silos and their level, the content inside and to operate on the silo you can just click the one desired in the overview.
Then in the “More Info” page there is a more detailed overview with the status of each silo, their content and a graph that shows the variation of the content’s level inside each silo.
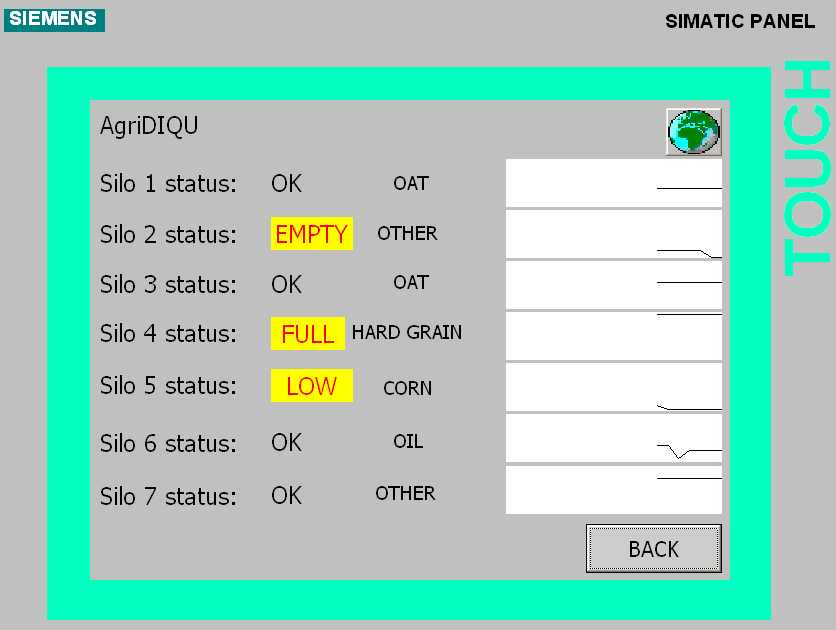
More languages are available just by ressing the top right button and the software will cycle to English, Italian, Spanish, German and French.
Script in Node js
There is two script in node, one received the Silos data from KepServerEx API gateway which contain the data of the seven level and the temperatures of each Silos.
We create a web server who remains listening until the data arrives and convert it to string data format to write it into Redis list
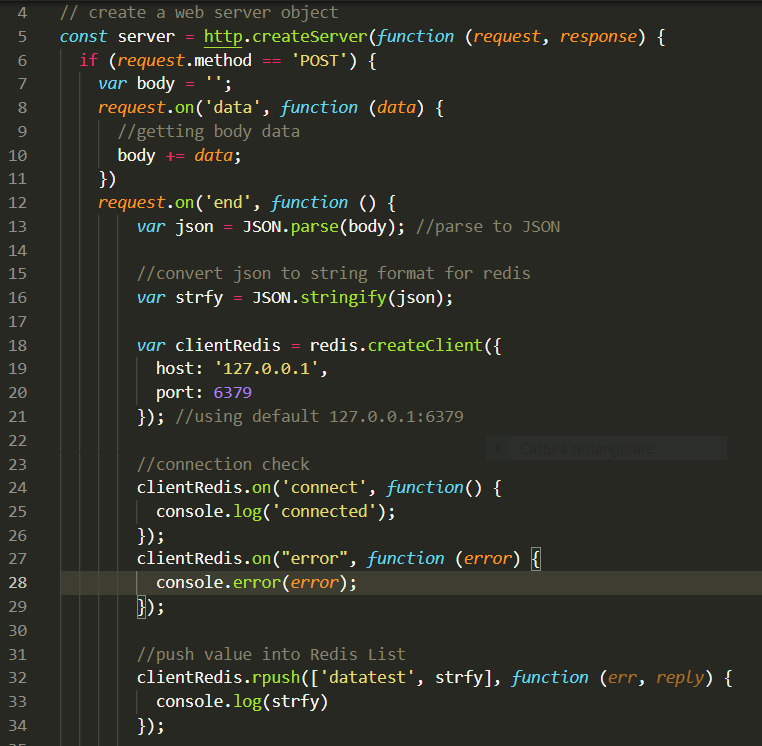
Redis
Redis is an open source (BSD licensed), in-memory data structure store, used as a database, cache, and message broker. Redis provides data structures such as strings, hashes, lists, sets, sorted sets with range queries.
In our case we use them for temporarly save the data in case of connection timeout with AWS Ec2 machines witch is installed influx db v2.0. When the connection down, every 10 seconds the web server continue to receive data from KepServer simulator and write them in redis. If the connection is established the second script promptly consumes all the data accumulated on redis up to that moment.
Cloud
Amazon Web Services
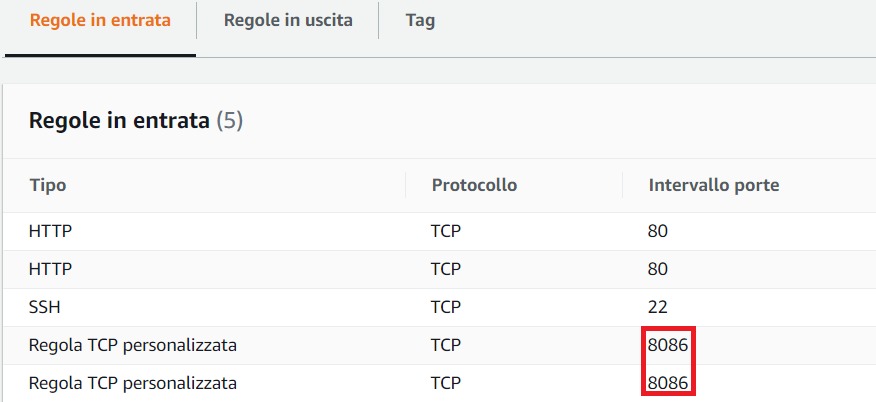
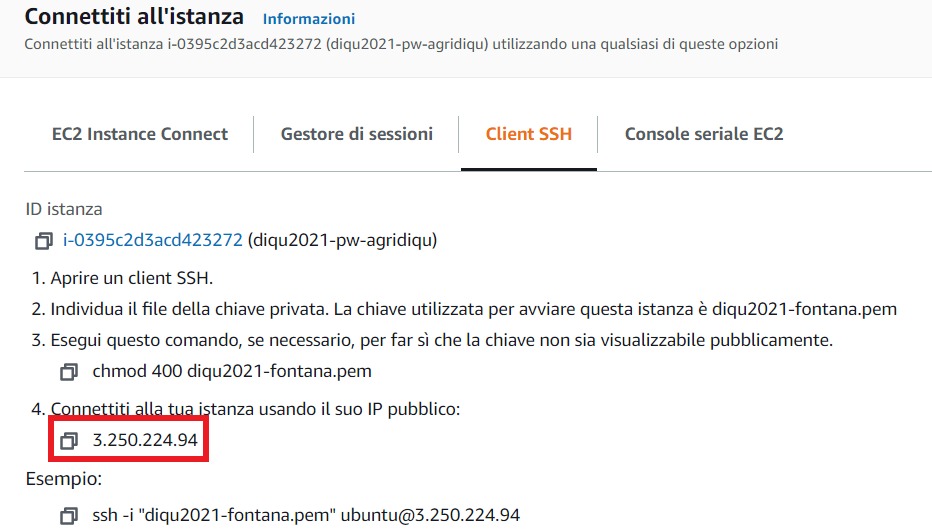
For the cloud part we have created an EC2 instance by connecting it to our security group to control both incoming and outgoing traffic.
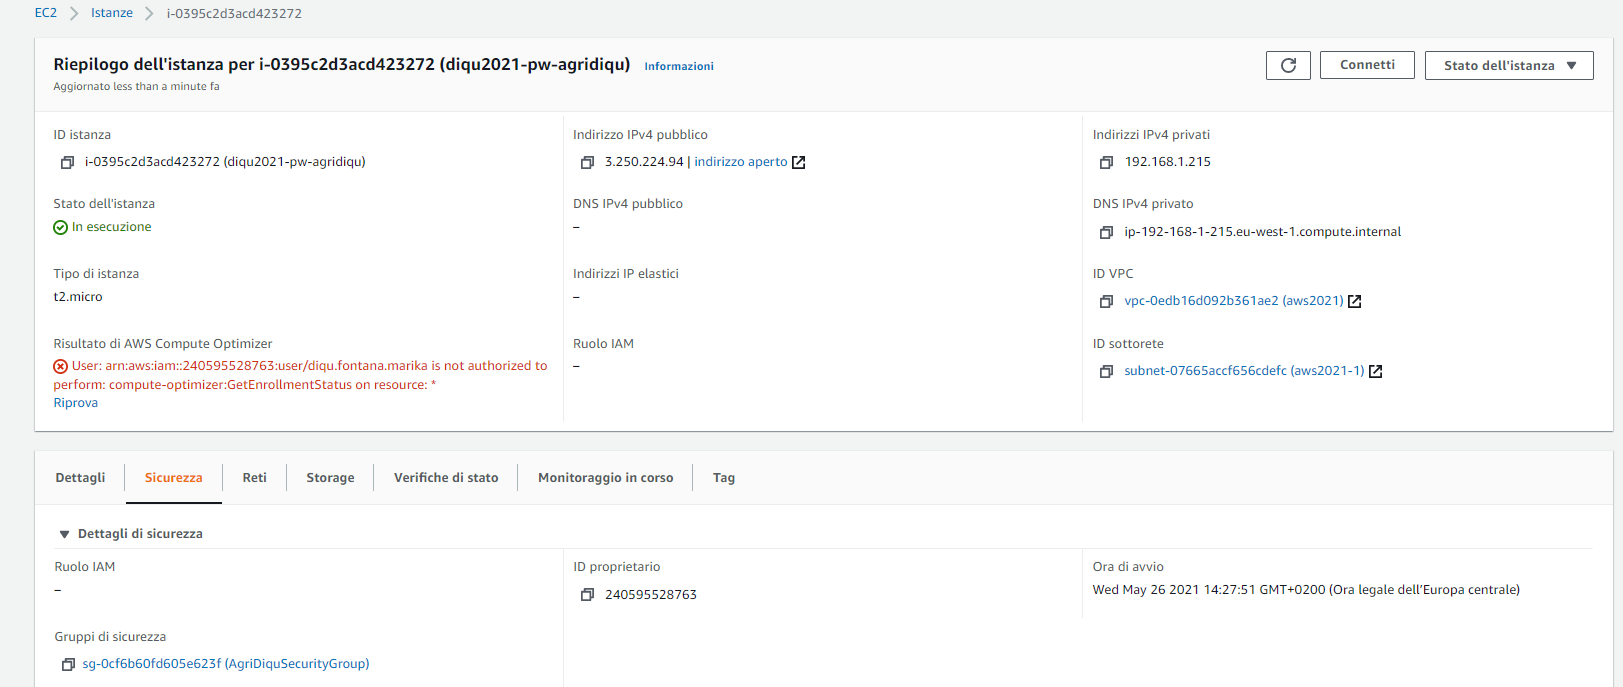
Thanks to our security group we can choose port 8086 to connect to influxdb/chronograf.
Our EC2 instance has got a public IP address, but it changes each time it is shut down and turned on again so it’s important to remember to change the destination on the index.js file.
InfluxDB and Chronograf
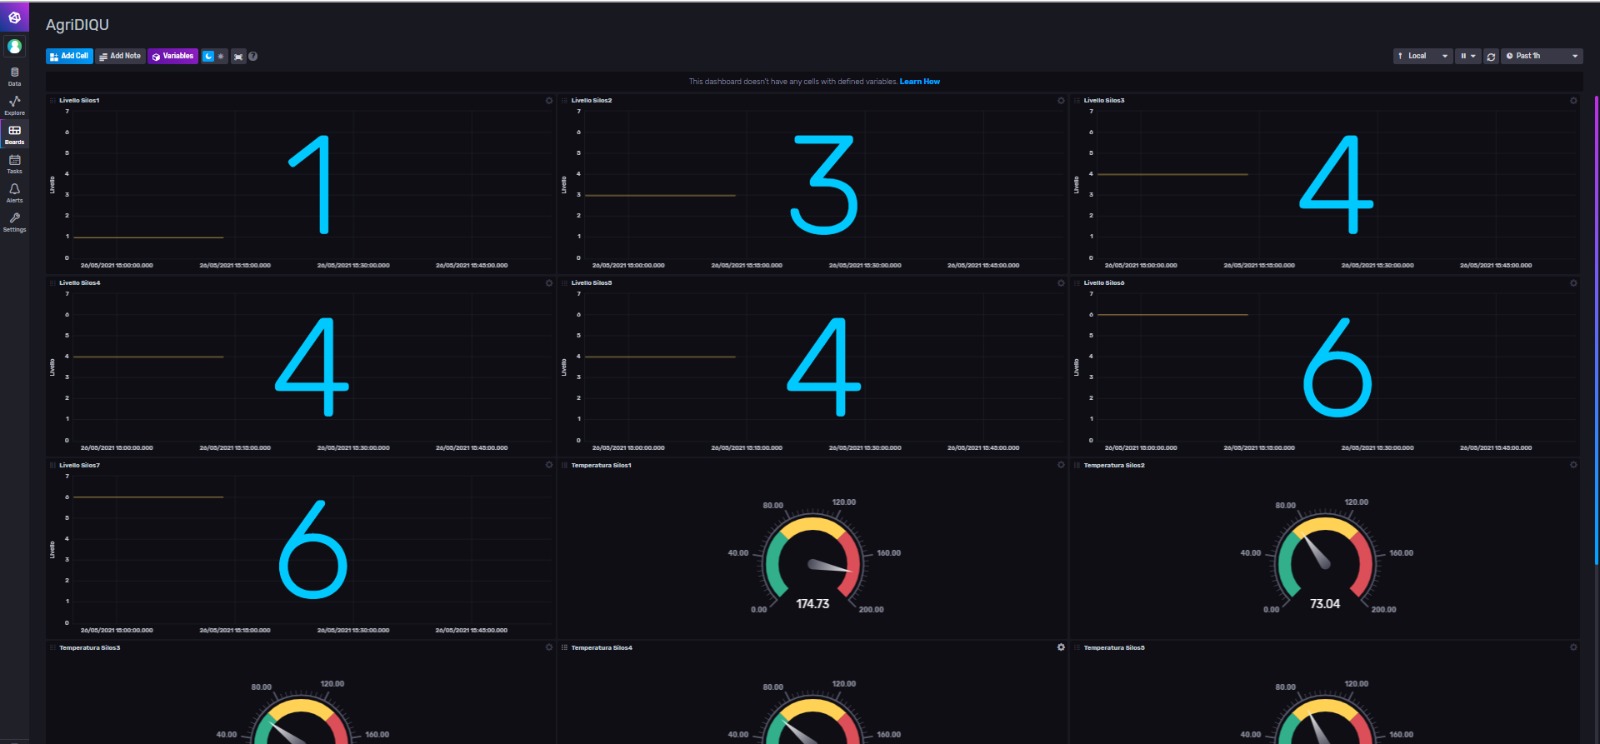
Opening a new search page and connecting to the IP address of the EC2 instance followed by port 8086, we can connect to InfluxDB and view the chronograf dashboards.
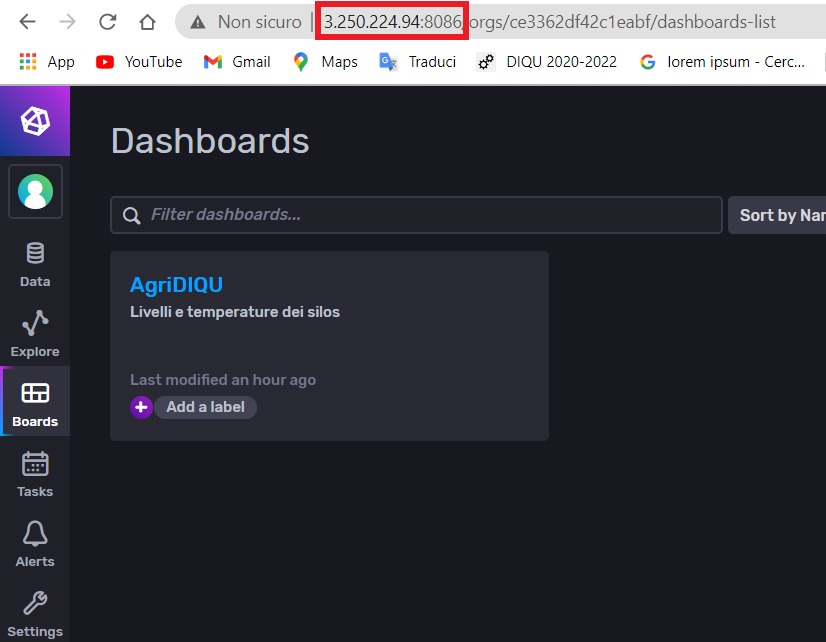
And finally we can see the dashboard with levels and temperatures of our silos!!!
Videos and other resources
Gallery
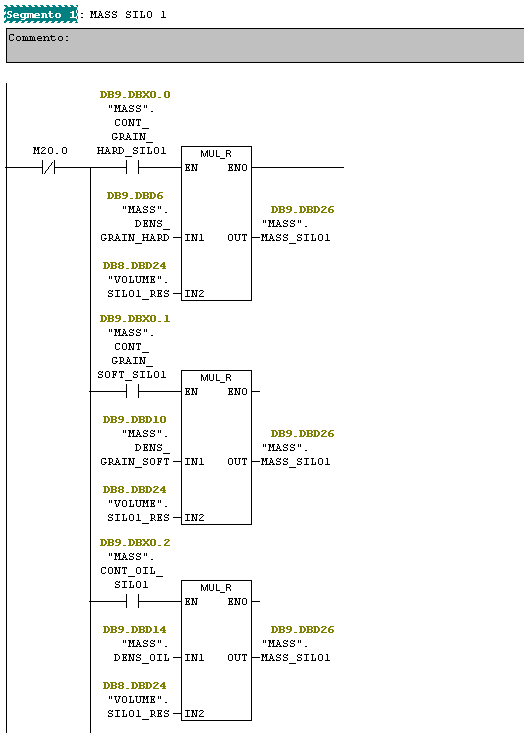
Block used to calculate mass
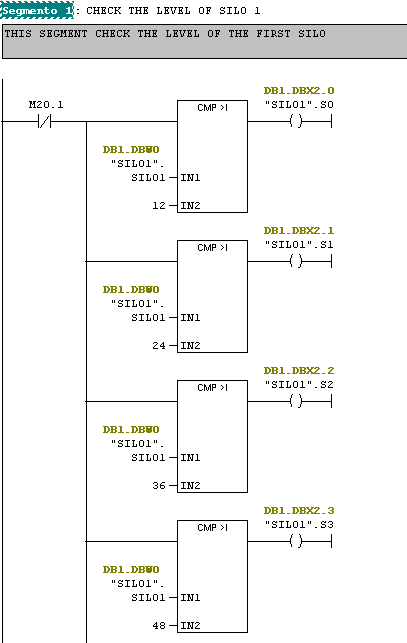
Block used to check the sensor level
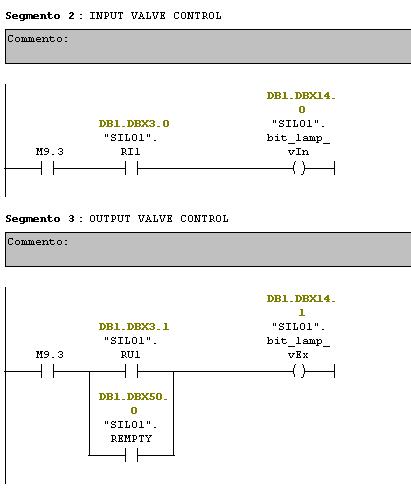
Block used to animate the valves in the HMI
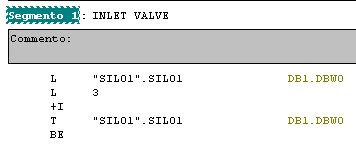
Block used to insert into the silo
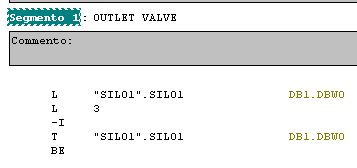
Block used to remove from the silo

DataBlock used to store silo information
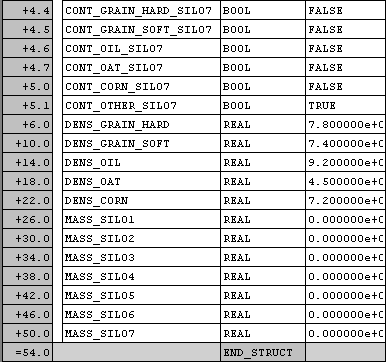
DataBlock used to store mass information

DataBlock used to store volume information